
What is a Candle ? Candlestick is most commonly used methodology in Technical analysis of Trading instruments, be it commodities or Stocks. Technical analysis was first started in Japan in 17th Century by Rice Traders. Later on Charles DOW initiated very modified version of technical analysis in US around 1900.
Technical analysis is based in the principal “The “what” (price action) is more important than the “why”. All known information is reflected in the price. Buyers and sellers move markets based on expectations and emotions (fear and greed). Markets fluctuate. The actual price may not reflect the underlying value.”
Candlestick based charting started sometime in 18th Century, and it was started by a rice trade named Homma. his ideas were refined and developed over the years and turned the candlestick charting we use these days.
How Candles are formed —
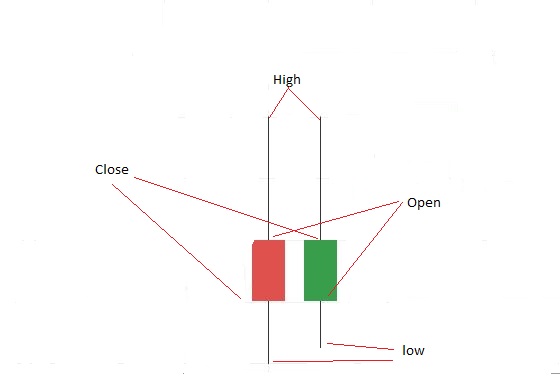
To Create a candle stick chart, you need candles of price action. Each candles denotes some time period which can be any thing ranging form 1 min to 1 month. To draw the candle you need Open, High, Low and Close values of that period. The hollow or filled body of candle is called the body. One end of Candle denotes Close and other denotes Open price. The Two thin lines appearing on each side are wicks/tails/shadow. Upper end shows high price whereas lower price shows Low of the mentioned time period.
There are multiple way to color code the candle stick, but what we represented in our image is most common. If a stock closes above Open Price a Green candle will be charted. If stock closes below open price a red candle will be drawn.

Among all the different charts used for technical analysis, candlestick charts are most common one and used by majority of Analyst, they are most easy to understand as well.